Used Equipment Market Reports Need Context
Why inventory, asking prices, and auction values can mislead buyers when they are not adjusted for seasonality, machine category, seller channel, auction volume, and data source.
Used equipment market reports provide useful information. They can reveal changes in advertised inventory, asking prices, auction results, transaction volume, and buyer activity.
But a market report is not the market.
It is a reading from a specific platform, during a specific period, across a particular mix of machines. The numbers may be accurate within that dataset without providing a complete picture of the broader used equipment market.
That distinction matters when contractors, dealers, used equipment managers, lenders, exporters, rental companies, and fleet owners use broad percentages to make buying, selling, and valuation decisions.
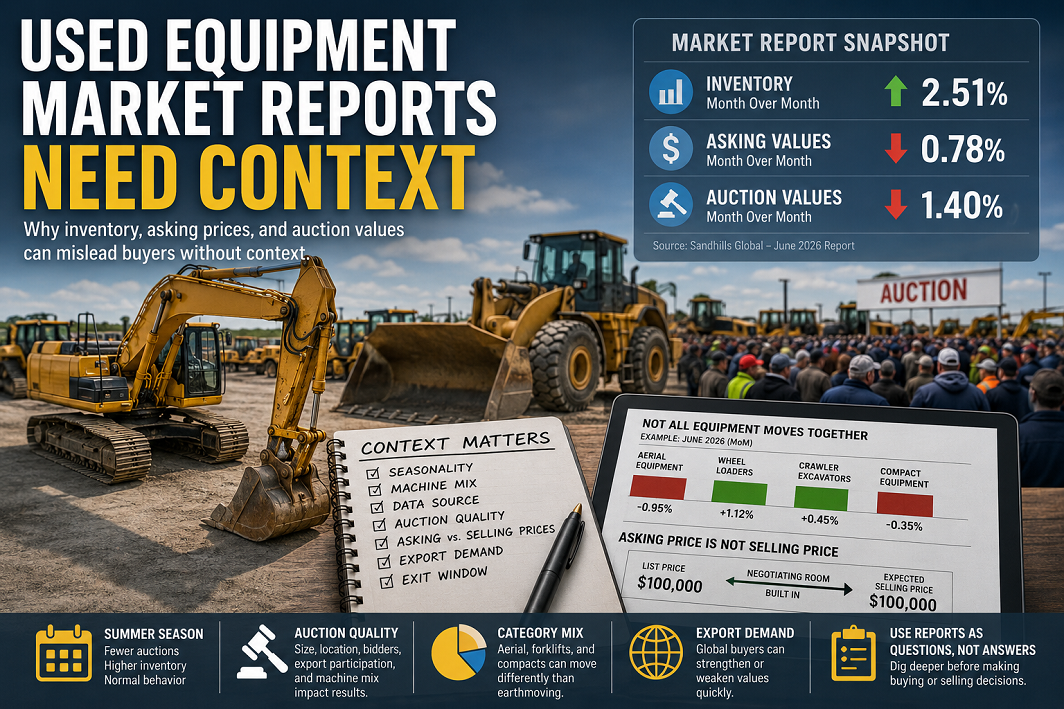
A recent Sandhills Global market report provides a useful example. For June 2026, Sandhills reported that U.S. used heavy-duty construction equipment inventory increased 2.51% month over month while remaining 10.15% below the previous year. Asking values declined 0.78% from May, while auction values declined 1.4%.
Those figures are legitimate signals from the Sandhills platforms. But none of them should be interpreted in isolation.
A 2.51% summer inventory increase does not automatically indicate oversupply. A 0.78% change in asking values is less than the negotiating room routinely built into most advertised prices. A summer auction decline does not carry the same weight as results from a major February or March auction.
The report provides the data.
The equipment professional still has to determine what it means.
Every Report Reflects the Platform That Produced It
The first question when reading a used equipment market report should not be, “What did the market do?”
It should be:
What portion of the market did this platform measure?
Sandhills has a large view of the used equipment market through MachineryTrader, AuctionTime, and its related platforms. That data may be directionally representative, but it is still Sandhills data.
It does not necessarily capture every dealer sale, private transaction, rental fleet disposal, export purchase, trade-in, regional auction, manufacturer sale, or transaction conducted through another major auction company.
Ritchie Bros. sees a different part of the market through Ritchie Bros. auctions, IronPlanet, Marketplace-E, and related channels. Rouse measures retail and auction activity through its own datasets and valuation services. Dealer websites show what sellers choose to advertise publicly. Private contractor-to-contractor sales may never appear in any public report.
Each source may be reporting real market behavior while observing a different group of machines, sellers, and buyers.
That is why two reports can appear to conflict while both remain technically accurate.
One platform may show increasing advertised inventory while another reports greater auction volume. One may show softer aerial-equipment prices while another records stable earthmoving values. One channel may be absorbing clean, late-model machines quickly while another accumulates older, higher-hour inventory.
The data source is not a technical footnote.
It is part of the conclusion.
Summer Inventory Can Rise Without Signaling a Market Reversal
Seasonality is one of the easiest factors to overlook in used equipment market reports.
Summer is production season across much of North America. Contractors are focused on completing work, managing crews, responding to weather, and keeping equipment operating. Vacations affect management availability. Rain, heat, hurricanes, and severe storms can disrupt activity in different regions.
The auction calendar changes as well.
Equipment continues to sell throughout the summer, but there are fewer large auction events capable of absorbing substantial amounts of inventory quickly. Auction activity normally begins building again in October and November before reaching its most active period around February and March.
When fewer high-volume auction avenues are available, machines that might otherwise be liquidated can remain advertised longer.
A dealer may continue carrying a machine rather than send it to a lightly attended summer auction. A contractor may wait until a project is completed before releasing surplus equipment. A rental company may keep a machine earning revenue through the busiest portion of the year. An owner with a clean unit may wait for a stronger selling window rather than accept a discounted summer offer.
All of that can increase published inventory without indicating that demand has collapsed.
Sandhills itself has previously described normal seasonal slowdowns in the machinery market. Its July 2025 report referred to a “typical summertime lull,” illustrating why monthly changes need to be viewed against recurring seasonal behavior.
That is why a 2.51% month-over-month inventory increase in June should not automatically be presented as evidence of oversupply or a market reversal.
The year-over-year comparison also requires context.
Sandhills reported that heavy-duty construction inventory remained 10.15% below June 2025. That may be important within its platforms, but it still describes only the machines visible within that dataset.
Another company may report selling more units than it sold during the same period a year earlier. That does not necessarily contradict the Sandhills inventory figure. One company may be measuring advertised inventory while another reports transaction volume through its auction channels.
Year-over-year increases in units sold, lots sold, or gross transaction value are important measures of auction-company performance. They may also support a favorable story for shareholders.
They do not tell an equipment buyer:
- Whether the machines were better or worse
- Whether more low-value units were included
- Whether growth came from one high-volume category
- Whether an acquisition added volume to the comparison
- Whether the average machine was older or newer
- Whether late-model earthmoving machines behaved differently from rental fleet disposals
- Whether increased volume caused prices to soften
A company can accurately report more machines sold while buyers experience weaker values in one category and stronger values in another.
Activity is not the same thing as value.
Asking Price Is Not Selling Price
Used equipment asking values show where sellers begin the conversation.
They do not necessarily show where transactions will finish.
Most experienced equipment sellers build negotiating room into the advertised price. A seller who intends to receive $100,000 for a machine will rarely begin by advertising it at exactly $100,000.
The machine may be listed at $104,000, $107,500, or another figure that allows the seller to show movement while still reaching the intended selling price.
That discount was anticipated before the advertisement was published.
Against that reality, a reported 0.78% decline in asking values says very little by itself.
On a machine advertised for $100,000, a 0.78% adjustment equals only $780. That is not necessarily a decline in the machine’s market value. It may simply be the seller moving slightly closer to the number expected from the beginning.
The seller’s real valuation may not have changed at all.
The original strategy may have been to advertise above the target, receive an offer, show some movement, and complete the sale near the intended price. The public asking price declined, but the expected transaction value remained the same.
A fractional monthly change can also result from ordinary inventory movement. Several dealers may have adjusted a few machines. Older or higher-hour units may have entered the dataset. Newer machines may have sold, leaving a weaker mix behind.
None of those possibilities establishes a broad decline in used equipment values.
There is another limitation: published asking-price indexes cannot fully capture private negotiation.
A dealer may leave a machine advertised at $110,000 while quietly becoming willing to accept $98,000. The published asking price appears stable even though the real market position has changed substantially.
Another dealer may publicly reduce the machine from $110,000 to $108,000 but refuse to accept less than $105,000. The index records a decline even though the likely transaction value has barely moved.
Asking-price data can become meaningful when movement continues across several months, multiple platforms, comparable machines, and clearly defined equipment classes.
A one-month 0.78% movement is not enough.
Until it is repeated, segmented, and confirmed by actual transactions, it is closer to statistical noise than a market correction.
Auction Values Depend on the Quality of the Auction
Auction values are completed transactions, but that does not make every auction result equally representative.
The same machine can produce different results depending on:
- Auction size and location
- Advertising exposure
- Registered bidder count
- Online participation
- Export-buyer activity
- Seller reputation
- Machine condition and presentation
- Inspection and maintenance records
- Transportation costs
- The number of comparable units offered
- The quality of the surrounding inventory
A major February auction with strong international attendance is not the same market test as a smaller regional summer auction.
Large auctions create urgency and attract buyers who have planned purchases around the event. Exporters may participate because enough equipment is available to justify inspections, inland transportation, and ocean freight. Dealers can purchase several machines efficiently. Contractors may have annual budgets and equipment plans ready.
A weak result from a lightly attended auction does not establish a new value for every comparable machine. An unusually high result produced by two determined bidders should not automatically become the benchmark either.
Coverage also matters.
Before relying on a reported auction-value trend, buyers should determine whether the data includes Ritchie Bros., IronPlanet, AuctionTime, regional auctioneers, rental fleet sales, dealer auctions, and online-only events.
Excluding a major auction channel can materially change the picture.
The Ritchie Bros. Q1 2026 Market Trends Report illustrates why category and volume must be examined together. Ritchie Bros. reported that aerial equipment, telehandlers, and forklifts experienced price declines partly because of higher volume. Earthmoving categories generally demonstrated greater pricing strength.
That is not necessarily inconsistent with a report showing softer overall construction equipment values.
It shows that different categories were doing different things.
Category Mix Can Distort the Headline
“Used construction equipment” covers an enormous range of assets:
- Crawler excavators
- Mini excavators
- Wheel loaders
- Dozers
- Skid steers
- Compact track loaders
- Backhoes
- Motor graders
- Articulated trucks
- Telehandlers
- Forklifts
- Boom lifts
- Scissor lifts
- Compaction equipment
- Trucks and trailers
These categories do not move together.
They serve different customers, follow different replacement cycles, and respond to different economic forces.
Aerial equipment is heavily influenced by rental fleet releases. Excavator demand may respond more directly to infrastructure, earthmoving, demolition, mining, residential construction, and export activity. Compact equipment may be driven by smaller contractors and landscaping markets. Large production equipment responds to major civil, quarry, industrial, and mining work.
Sandhills’ June report illustrates these differences. Heavy-duty construction asking values declined 0.78% month over month, while medium-duty construction asking values increased 0.19%. Aerial asking values declined 0.95%, but aerial auction values increased slightly.
Those are not minor variations within one market.
They are different markets.
Ritchie Bros. also reported weaker pricing in aerial equipment, telehandlers, and forklifts while earthmoving categories generally showed more strength during the first quarter of 2026.
A large influx of scissor lifts, telehandlers, or forklifts can pull down broad percentages without saying much about a clean crawler excavator or wheel loader.
The headline may be mathematically correct and still be practically irrelevant to the machine being evaluated.
Machine Class Matters as Much as Machine Category
Even category-level reporting may be too broad.
Consider the term “crawler excavator.”
That category can include an older compact excavator worth approximately $15,000, a late-model 20-metric-ton production excavator worth well into six figures, and a large mining or mass-excavation machine worth $1 million or more.
They share a category name but not the same buyers, applications, transportation requirements, financing options, ownership costs, or resale markets.
A meaningful excavator valuation should consider:
- Size and operating weight
- Model and configuration
- Age and hours
- Emissions tier
- Undercarriage condition
- Hydraulic condition
- Boom, arm, and attachment configuration
- Maintenance history
- Geographic location
- Dealer and parts support
- Export eligibility
- Transportation costs
- Current project demand
A clean, low-hour, late-model excavator may attract contractors, dealers, rental companies, and exporters simultaneously. An older, high-hour machine may appeal mainly to buyers who can repair it economically or use it in a less demanding application.
Combining those machines into one percentage conceals more than it reveals.
The same applies to wheel loaders. A compact loader used in landscaping does not trade like a large production loader working in a quarry. A waste-handler configuration has a different buyer pool from a standard bucket machine.
The article Used Equipment Market: 7 Price Signals Buyers Miss explains this broader division in more detail: the used equipment market is not one market. Different buyer groups, machine classes, regions, seasons, and exit strategies create overlapping submarkets.
Market reporting becomes useful only when the data is segmented closely enough to resemble the machine being evaluated.
More Units Sold Does Not Automatically Mean a Stronger Market
Transaction volume matters, but it can be interpreted incorrectly.
When a rental company, contractor, government fleet, or dealer group releases a large number of similar machines, total unit sales can increase while prices soften. Buyers have more choices, and comparable units compete against one another.
More machines sold does not necessarily mean greater demand.
It may mean more supply was released.
The opposite can happen as well. Low transaction volume may make values appear stable because few machines are available. A category can show strong median pricing simply because only its cleanest units reached the market.
Ritchie Bros. reported that higher volumes contributed to weaker pricing in several aerial and material-handling categories during the first quarter of 2026. At the same time, earthmoving categories generally maintained greater pricing strength.
That relationship is critical.
Volume, average price, machine quality, and category mix can move in different directions. A year-over-year increase in units sold may be good news for an auction company without proving that the average machine became more valuable.
Sometimes the market did not change as much as the headline suggests.
The machines being measured changed.
Month-Over-Month and Year-Over-Year Comparisons Answer Different Questions
Month-over-month figures identify recent movement. They can reveal changes in listing volume, seller behavior, and auction activity.
They are also highly vulnerable to seasonality and inventory mix.
Year-over-year comparisons reduce some seasonal distortion by comparing the same calendar periods. But they can still be affected by rental fleet cycles, acquisitions, interest rates, emissions regulations, construction demand, and unusual conditions in the previous year.
Neither measure should stand alone.
A monthly inventory increase combined with a year-over-year decline may indicate a normal seasonal buildup within a market that remains tighter than it was a year earlier.
A monthly value decline combined with stable longer-term pricing may reflect temporary softness rather than a sustained correction.
The most useful analysis considers:
- Month-over-month movement
- Year-over-year movement
- Several years of seasonal history
- Transaction volume
- Machine age and hours
- Category and model mix
- Asking-to-auction value spread
- Seller channel
- Export participation
A percentage becomes meaningful only after the reader understands what is being measured and what it is being compared with.
Export Demand Can Change the Result
The used equipment market is global, especially for durable machines that can be supported economically and transported relative to their value.
Export demand can strengthen an auction when overseas buyers are active. It can also weaken quickly because of currency movements, freight rates, financing conditions, tariffs, port congestion, political risk, or construction slowdowns in destination markets.
Exporters do not buy every machine equally.
Brand support, parts availability, emissions systems, engine type, machine size, shipping cost, and destination-country regulations all influence demand.
A machine that appears expensive to a domestic buyer may be attractive in a country where that model is difficult to find. Another machine that sells well domestically may have limited export appeal because it is too costly to transport or difficult to support.
A regional auction attended mainly by local buyers is not equivalent to an event with participation from Latin America, the Middle East, Africa, Europe, and Asia.
That difference can materially affect auction depth and price.
Use Market Reports as Questions, Not Answers
Before changing a purchase offer, reserve value, trade allowance, or fleet-disposal plan because of a broad market percentage, ask:
- Which platform produced the data?
Determine which listings, transactions, auctions, and regions are represented. - What period is being measured?
A one-month change may reflect normal seasonality. - Is the comparison month over month or year over year?
They answer different questions. - Which categories drove the movement?
Aerial equipment may be moving differently from earthmoving equipment. - Are the figures asking prices or completed sales?
Seller positioning and transaction values are not interchangeable. - Which auction channels are included?
Excluding a major venue can change the result. - Was the data adjusted for equipment mix?
Age, hours, condition, class, and configuration matter. - Is the movement normal for this season?
Compare it with previous years and the auction calendar. - What is the likely exit window?
A machine bought in July and sold in February faces a different market from one that must be liquidated in 30 days. - Are export buyers active?
International participation can materially affect values. - Are clean machines behaving differently from average inventory?
Broad statistics often hide strength in late-model, low-hour equipment. - Does the report actually describe the machine being evaluated?
National crawler excavator data may offer limited guidance for one model, size, age, hour range, and region.
These questions do not make market reports less valuable.
They make the reader more capable of using them correctly.
Market Reports Are Clues, Not Conclusions
Used equipment market reports belong in every professional buyer’s and seller’s decision process.
They can identify developing trends, changes in supply, differences between asking and auction values, and shifts in buyer activity.
But the market cannot be reduced to one platform, one month, one category, or one percentage.
The previous HEPLANET analysis established that used equipment is not one market.
The same principle applies to the reports attempting to measure it:
Used equipment market reports are not the market.
They are measurements taken from within it.
The real work is connecting those measurements to seasonality, machine condition, auction quality, category mix, buyer psychology, rental fleet cycles, export activity, and the eventual resale window.
A report can tell you that inventory increased.
Experience helps determine whether that inventory is accumulating because demand is weakening, auctions are temporarily slower, sellers are waiting for a better window, or the machines entering the dataset are simply different from the ones that sold last month.
Market data matters.
Context determines what it means.
Frank Eusebio has more than 30 years of experience in heavy equipment sales, equipment and fleet management, Komatsu dealer operations, used equipment valuation, export markets, lease returns, dealer inventory strategy, and construction equipment remarketing. He created and implemented Develon’s remarketing program across its dealer network. At HEPLANET, he writes about equipment markets, fleet decisions, ownership costs, resale value, auction trends, parts support, and the real-world economics affecting contractors, dealers, rental companies, and equipment owners.